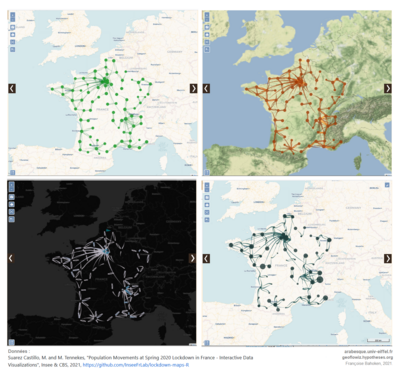
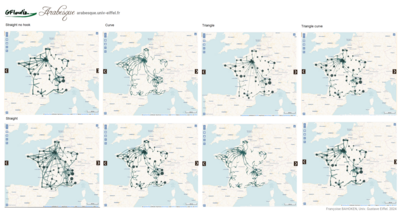
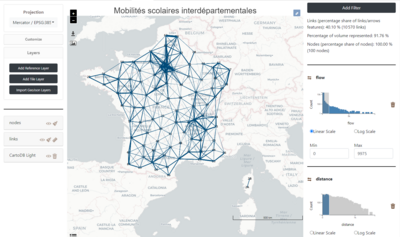
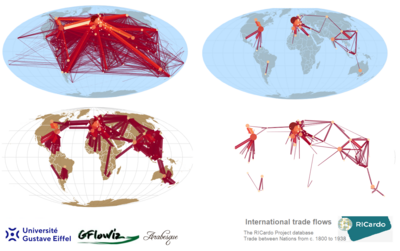
Detailed view
Arabesque
Arabesque is a new web application for geo-visualization of data describing spatial networks.
It allows the creation of flow or origin-destination movement maps at various geographic scales, directly from a web browser equipped with Mozilla, Chrome, or Brave, leveraging current technological capabilities, particularly those offered by new web visualization and mapping libraries (OpenLayers, d3, OSM, Turf, NaturalEarthData).
Arabesque enables users to import their own dataset (a simple or complex OD matrix), explore it, configure geographic (tiles, etc.) and statistical (filtering, etc.) parameters, and design it in accordance with cartographic semiology, to generate an intelligent and stylish geo-visualization of flows and movements.
Keywords: Geography, Statistics, Spatial Analysis, Geomatics, Geo-visualization, Cartography, Information and Communication, Spatial Network Analysis, Representation of Spatial Mobilities, Flow Mapping.
Practical information
Themes/sub-themes
- Environment and Territories
- Data processing
Industrial sector(s)
- Food industries
- Automotive industries
- Railway industries
- digital infrastructures industries
Laboratory
- AME / SPLOTT - Systèmes Productifs, Logistique, Organisation des Transports et Travail
Field of expertise
- Cartography
- Geomatics
- Geo-visualization
- Networks
Some photos
The platform in detail
Issues and Objectives of the Development of Arabesque:
The analysis of the dynamics of urban areas or metropolitan regions, the delimitation of their functional areas, and the spatio-temporal comparison of their patterns are often hindered by two categories of issues inherent to data and tools. The lack of open data describing various types of territorial interactions and interrelations limits the possibilities for empirical analysis. Additionally, the absence of dedicated tools for analysis and geo-visualization contributes to the absence of many visually and analytically significant images from the current cartographic landscape. Beyond issues related to data publishing, which involve specific challenges, we aim to focus attention on the current possibilities of online cartographic production.
State of the Question:
The range of current possibilities for exploring flow and network data on the geoweb reflects the growing interest from an interdisciplinary community. While efforts have long been limited to direct visualization, there has been a recent emergence of applications specifically dedicated to thematic analysis of these flows.
Three approaches seem to coexist:
- The first focuses on displaying large datasets in a digital cartographic form, as seen in platforms like Comtrade (https://comtrade.un.org/).
- The second approach centers on the visual geo-exploration of users' own data, as in flowmap.blue (https://flowmap.blue/ by Boyandin, 2018), using different graphical methods to allow co-visualization, such as The Vistorian (https://networkcube.github.io/vistorian/index.html, Bach et al., 2018) and Netscity (https://www.irit.fr/netscity/, 2019).
- The third approach is specific to large-scale online mapping software infrastructures such as Magrit (http://magrit.cnrs.fr) or Kepler (https://kepler.gl/), developed to address gaps in current mapping tools. It is noteworthy that these solutions are often linked to the growing practice of open-source development for reproducibility (Giraud, Lambert, 2017).
Towards a Visualization Cartography of Flows and Networks:
However, few applications seem fully aligned with the "visualization cartography" paradigm as defined by A. Mac Eachren (2004). Efforts still largely focus on layer display and simple exploration; there is little integration within a single interface of the two pillars of cartographic representation: (geo)visualization itself and the upstream processing of statistical and geographic data.
General Objectives of Arabesque:
The purpose of the Arabesque application is to meet the high demand for analyzing users' own OD datasets in a free, open-source, and user-friendly manner – a need identified through a survey we conducted in 2018. This application, developed within the framework of the Lemaire Law for a Digital Republic, aims to enhance the understanding of the geographic determinants of spatial mobility of goods and people. It seeks to meet the imperative of visualizing results from both fundamental and applied research, which stems from theoretical and methodological developments that can be considered cross-cutting across various themes (population, housing, environment, transportation, etc.) and inherently interdisciplinary (geography, demography, environmental studies, geomatics, engineering, social sciences, etc.), due to the societal challenges posed by the digital society.
From a scientific perspective, this application aims to innovate in the manipulation of digital data describing localized flows and networks currently available on the geoweb (Bahoken et al., 2020). It is, therefore, part of the new "visualization cartography" paradigm (Mac Eachren, 2005), which involves combining geo-visualization and the processing of geographic and statistical information in a single environment – initially with a descriptive focus. Moreover, it allows for the inclusion of complex relational datasets that may be large and represent multiple dimensions of spatial mobility (several thematic categories and/or timeframes). Special attention is also given to the rendering itself, both in terms of design and the cartographic semiology of the figures. The goal of improving the qualitative output of the images produced should lead to a more thoughtful approach to geo-visualizing mobility and spatial interactions.
Contacts
Contact and manager
Françoise BAHOKEN, Etienne CÔMEAddress
Fixed phone
01 81 66 87 82Mail
francoise.bahoken@univ-eiffel.fr , etienne.come@univ-eiffel.frUseful link
https://arabesque.univ-eiffel.fr/
Location
Fixed phone
01 81 66 87 82Mail
francoise.bahoken@univ-eiffel.fr , etienne.come@univ-eiffel.frUseful link
https://arabesque.univ-eiffel.fr/


